Understanding business dashboards: Examples and tips to try in your business

You can’t make smart decisions without data, which is why you always need a solid grasp of essential business metrics. However, achieving that isn’t always easy, particularly if you’re dealing with raw data at your accounting or professional services firm. When all you have are rows of numbers on a spreadsheet, it’s much more difficult to visualize your business’ performance.
Enter business dashboards.
When set up properly, these dashboards provide a user-friendly view of how your business is doing, so you can quickly spot trends and derive insights.
This article will shed light on the importance of business dashboards and offer tips to help you get the most out of them. You will learn:
What business dashboards are
The benefits of using business analytics dashboards
The metrics that your dashboard should contain
An example of a robust dashboard for service professionals
How to create or access a business dashboard
Let’s dive in.
What are business dashboards?
A business dashboard (sometimes called “business analytics dashboard” or “business intelligence dashboard”) is a tool that displays important metrics about your business for easy consumption and analysis.
“Business dashboards showcase current data relating to key performance indicators of your business which help you track towards your business goals,” says Fergus Gillanders, Account Manager at Ignition.
“They provide a snapshot of information and can highlight information such as profitability, staff performance, and job completion rates — which are all important metrics to observe when running a business like an accounting, design or professional services firm.”
The benefits of using business analytics dashboards
Business intelligence dashboards can unlock several benefits. Consider the following.
Keeps you informed about business performance
At a fundamental level, business dashboards surface your key performance indicators and give an at-a-glance view of how your company is doing. It shows you if your initiatives are working, whether or not you’re on track to reach your goals, and if your business is heading in the right direction.
For instance, if you run an accounting firm and have set certain revenue goals for the quarter, then having a dashboard that tracks the funds that are coming in will give an indication of how you’re doing.
Knowledge about your business also reduces anxiety and uncertainty. As Peter Morgan, a Chartered Accountant who is also an Account Manager Ignition puts it, you can gain “peace of mind from knowing if the dashboard level metrics are under control and the business is operating as intended.”
Warns you about potential problems and urgent issues
Now, if there is something wrong, a business dashboard can give you a heads up sooner rather than later. Business dashboards can provide “early warning of actions required to correct urgent issues,” adds Peter.
Let’s say you look at your dashboard and see that your profits took a hit due to unforeseen circumstances. With that knowledge top of mind, you can quickly gear up into action to bring in more business and lower expenses.
Prods you to work on the business, instead of just in it
A business dashboard also “encourages and supports a habit of working on the business rather than just being a technician,” says Peter.
As a business owner and practitioner, it’s all too easy to fall into the pattern of just working in the business and not on it. And while there’s nothing wrong with wanting to serve your clients, you should also set aside time for activities that can grow and uplevel your business.
When you have a dashboard that puts essential KPIs front and center, your business stays top of mind, and you’re more likely to work on it (instead of just in it.)
What should the business dashboard contain?
Now that we’ve covered the fundamentals of the business dashboard, let's discuss the information that your dashboard should contain. It’s worth noting that specific KPIs may vary from one business to another, depending on the firm’s priorities.
For instance, if your number one objective is to grow your bottom line, then your dashboard should contain KPIs that focus on revenues and profits. On the other hand, if your priority is client retention, then you’ll have more client-centric metrics on your dashboard.
That being said, here’s a rundown of the common KPIs for professional service providers.
1. Revenues
How much money you’re bringing in should be the primary metric you’re tracking. Depending on your business model, you can look at revenue from a number of different angles, including:
Monthly recurring revenue (MRR). “MRR is the king of all KPIs for a professional services business that is operating on a subscription or recurring monthly revenue model (as is best practice),” explains Peter.
Your monthly recurring revenue sheds light on business growth and stability, which can then inform your decisions when it comes to hiring, software investments, expansion, and more.
Average client revenue. It’s also helpful to see how much clients bring in on average. Knowing this metric allows you to put a figure on the value of your clients, which can inform your budgeting decisions, particularly around sales and marketing.
Average team revenue. Knowing how much revenue you earn per team member can inform your decisions around hiring and staffing to ensure that you’re never over or understaffed.
Unbilled projects. This metric sheds light on revenues that are about to come in, which can help you make future projections.2. Job turnaround time
Fact: clients want fast turnaround times. Peter points out that lengthy turnaround times are one of the top 3 reasons that clients leave their accountants.
This KPI matters a great deal to your clients, which means it should matter to you. Closely monitoring your job turnaround time helps you improve it, which ultimately keeps your clients happy.3. Client Net Promoter Score (NPS)
4. Number of clients
5. Employee NPS
Business dashboard example for professional service providers (e.g., accountants and bookkeepers)
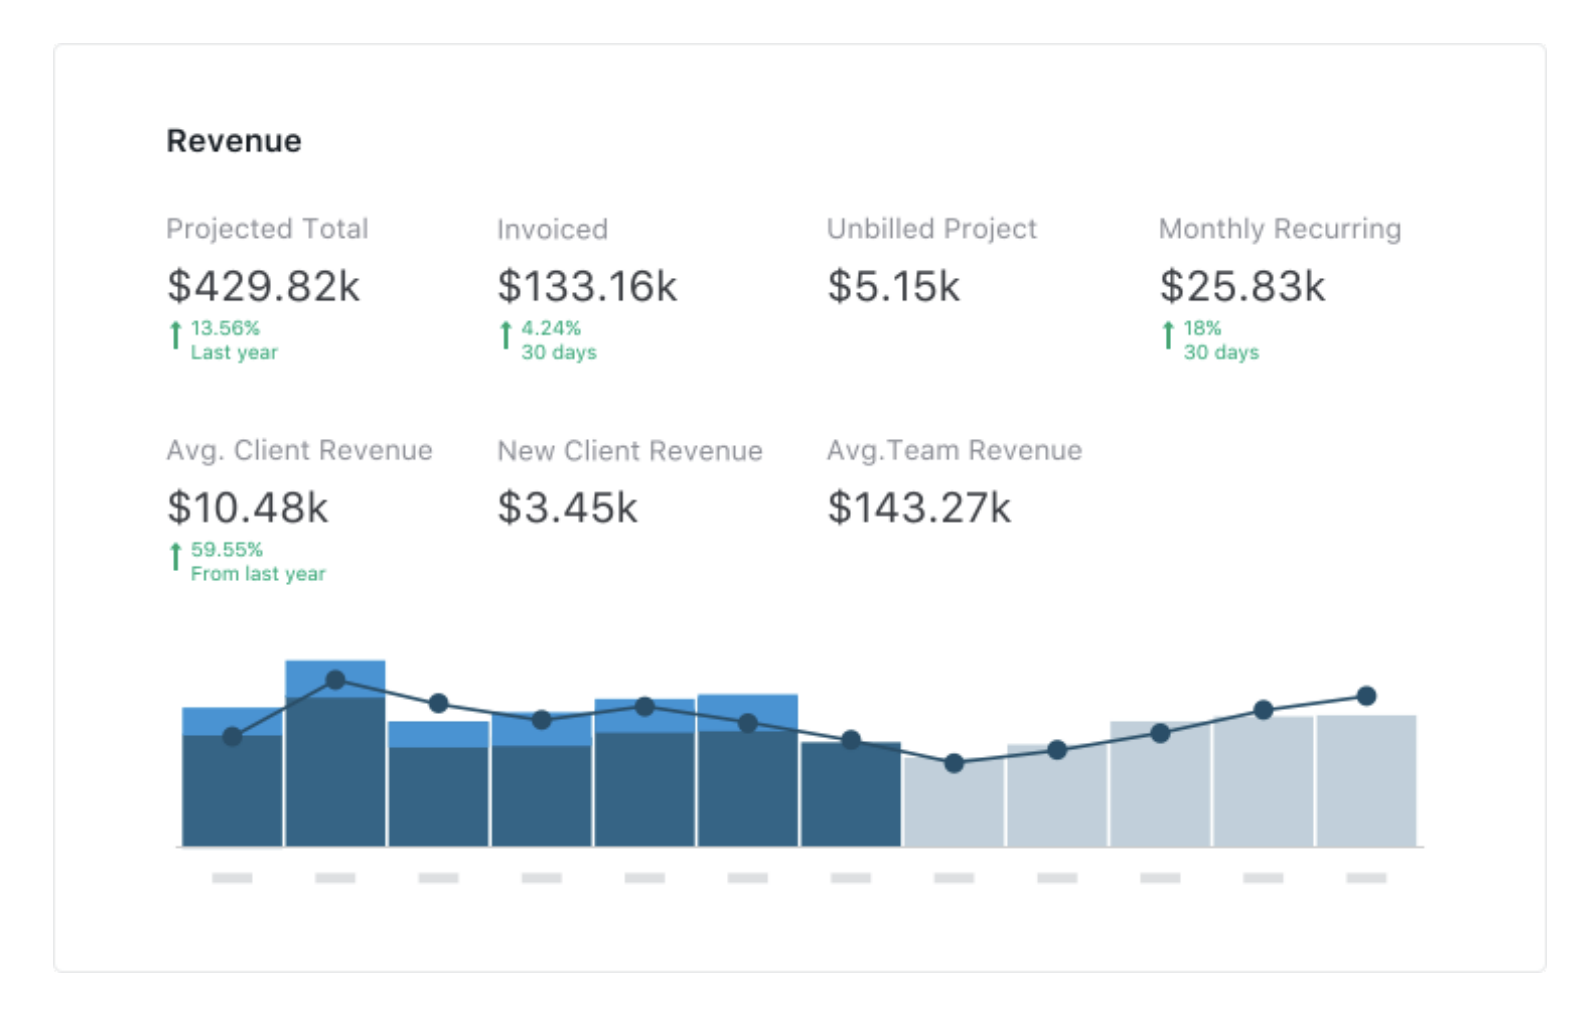
It contains many of the metrics mentioned above, including MRR, average client revenue, number of clients, and more. There’s also a Payments panel, which sheds light on metrics like projected total payments, scheduled recurring, and expired credit cards.
Ignition’s Business Dashboard makes projections based on the data you have on hand, making it easy to plan ahead.
How to create or access a business dashboard
The easiest way to access a business dashboard is to use a platform that has solid analytics capabilities. Ignition, for example, has a dashboard specifically designed for professional service providers that work with clients and earn recurring revenue.
If you need a dashboard that displays KPIs specific to your business, it may make sense to have one that’s custom-created for you using a data platform such as Power BI or Tableau.
“It’s best to use an external facilitator proficient at automating the data gathering process into something like Power BI. If it takes too long to gather the data the benefit of the dashboard won't match the cost of the data gathering,” says Peter.
He adds that you can also “build your own 'Plan on a Page' in Excel easily enough, or use other software.” Just be mindful of the time and effort you put in by going the DIY route.
Final words
You can’t grow your business if you don’t have a solid understanding of its performance. That’s why it’s worth investing in a solution that makes it easy for you to access and track key metrics in your firm.
If you’re a professional service provider, Ignition can help you do just that. Our Business Intelligence Dashboard puts you in control so you can make clear, confident decisions. Info on your sales pipeline, upcoming client renewals, and forecasted revenue are all just a click away.