Using services data to grow your business

If you use Ignition and have implemented it across your entire client base, you can gain valuable insights into your business by analyzing the services data in your account.
You can gain insights into which services your clients are paying for which helps you identify areas of growth and/or to optimize your offerings.
Let’s take a look at which reports you can export and how to use these effectively in your business.
Client services export
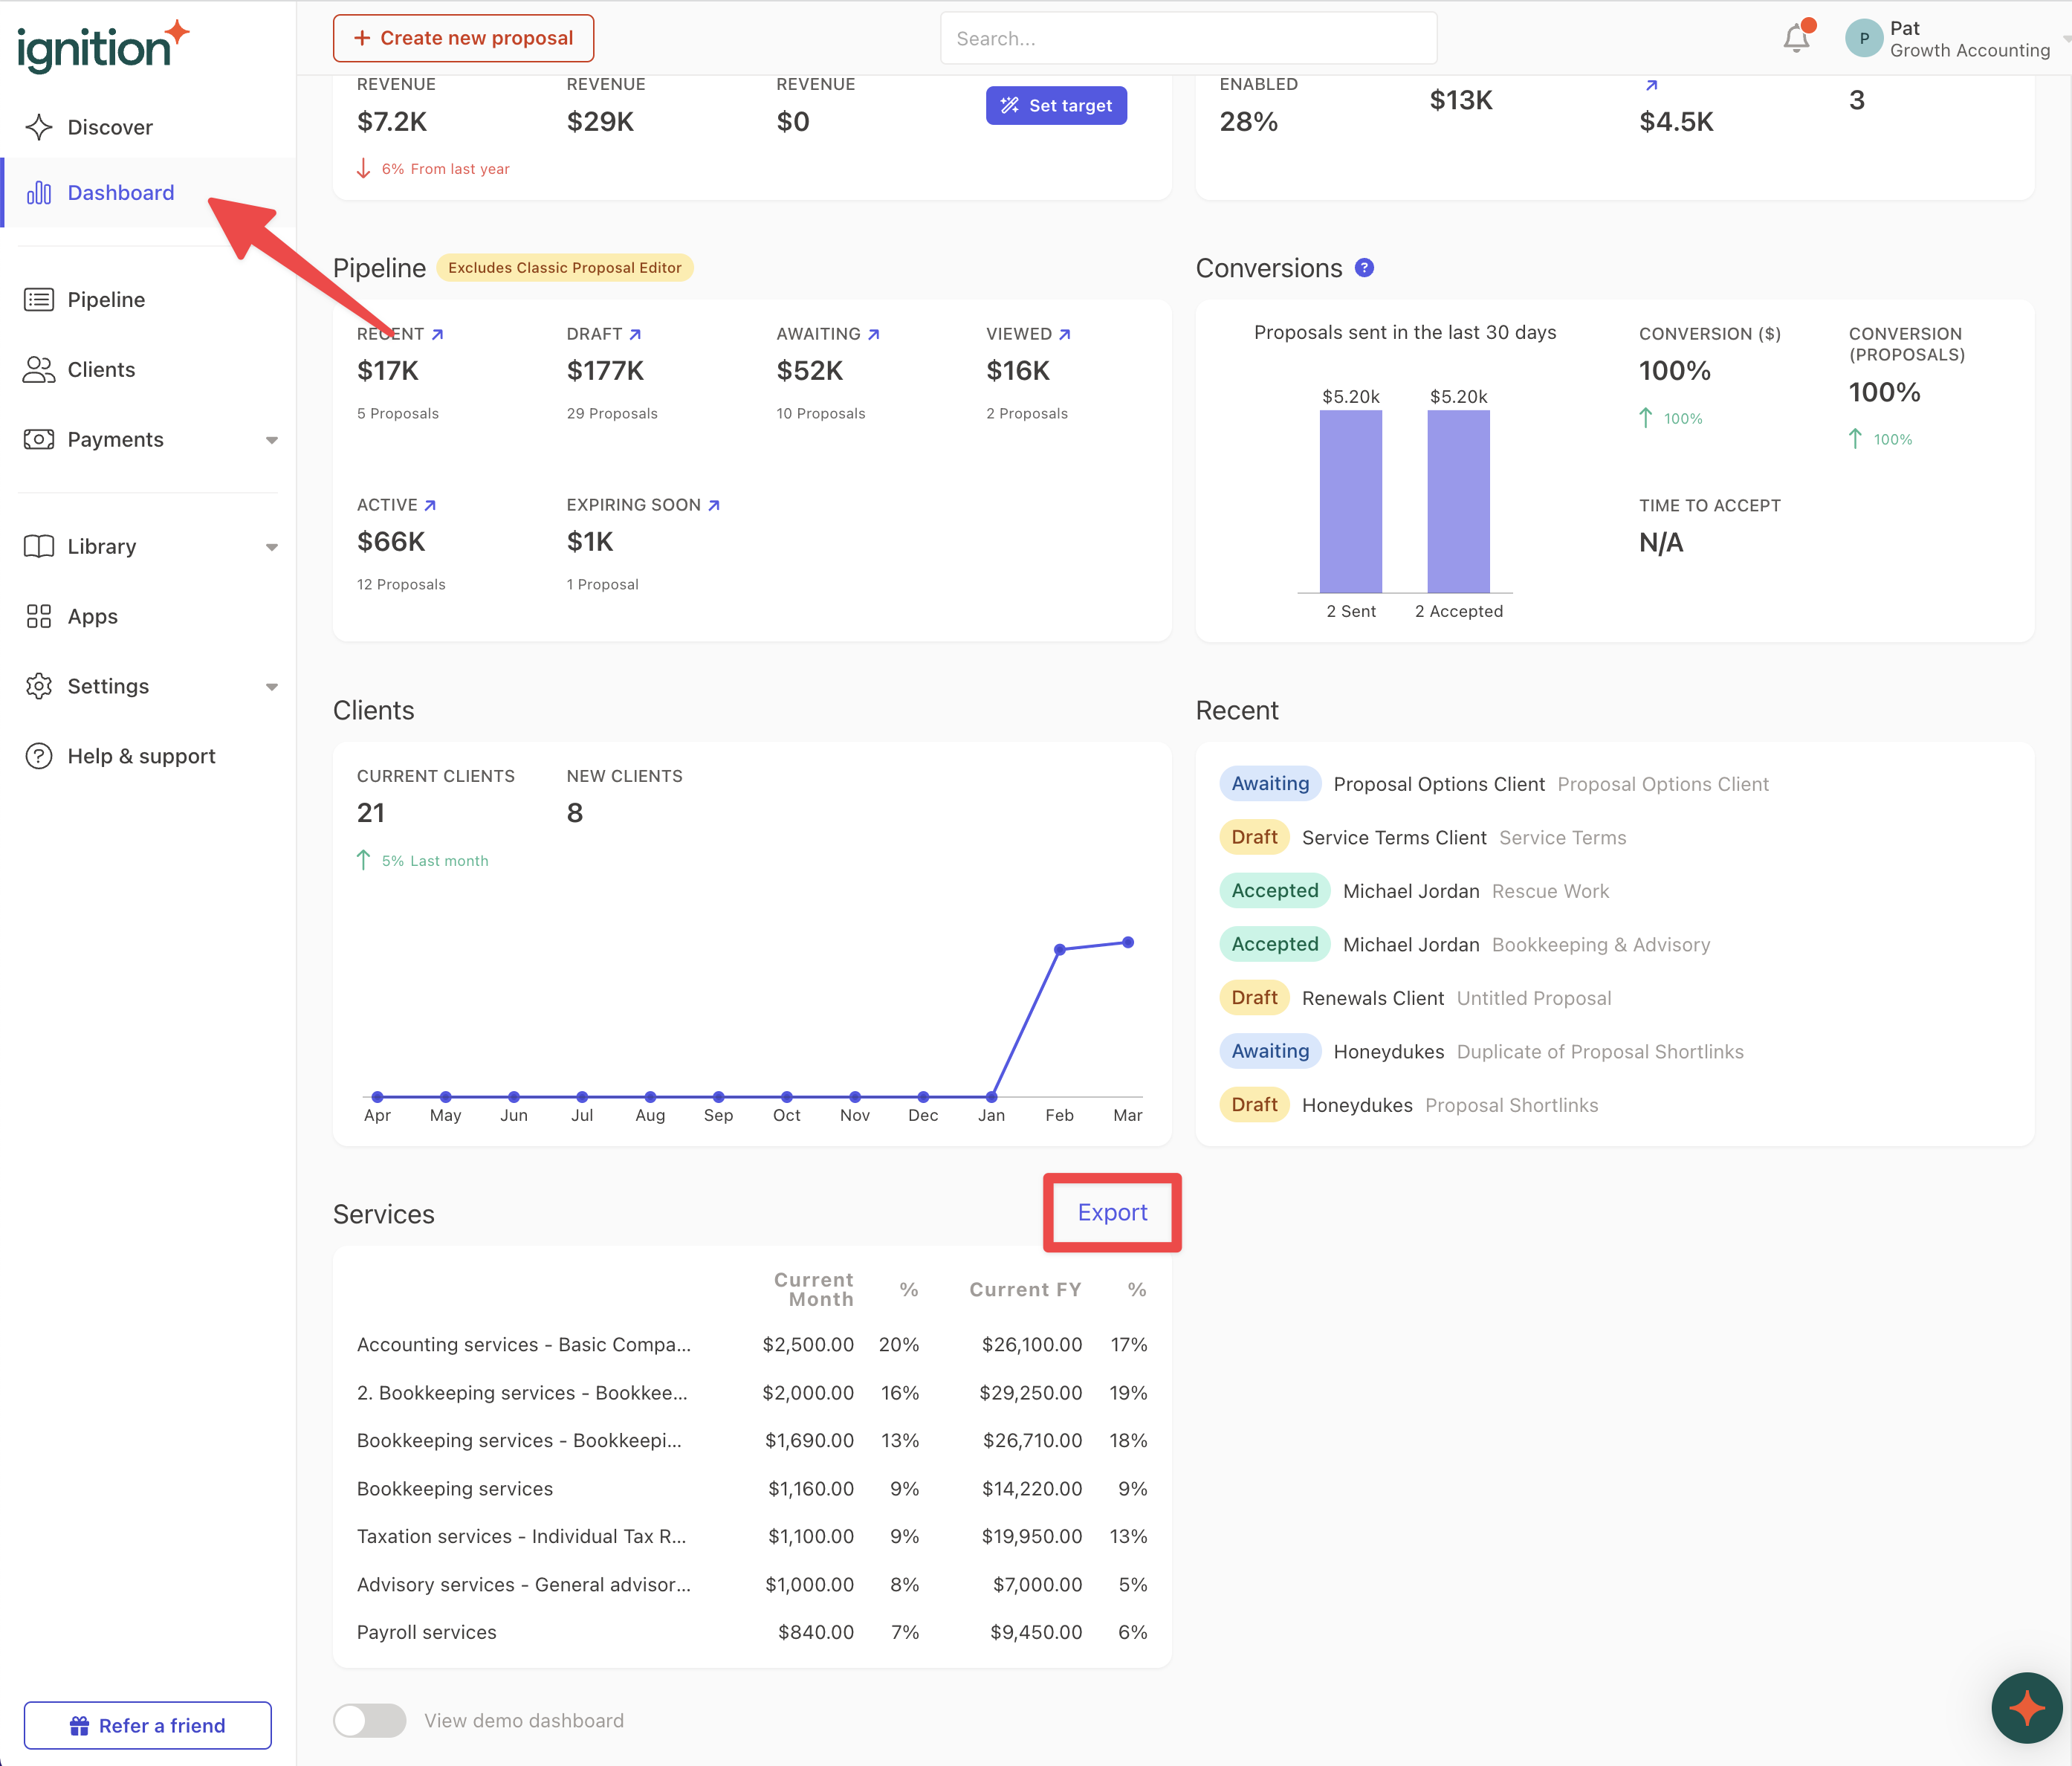
Navigate to your Dashboard tab and click Export in the top right hand corner of the Services section.
In the pop up window, select the Reporting Period you would like to export. Typically we recommend exporting via calendar or financial years so you can get an overview of the data year on year for more comparisons.
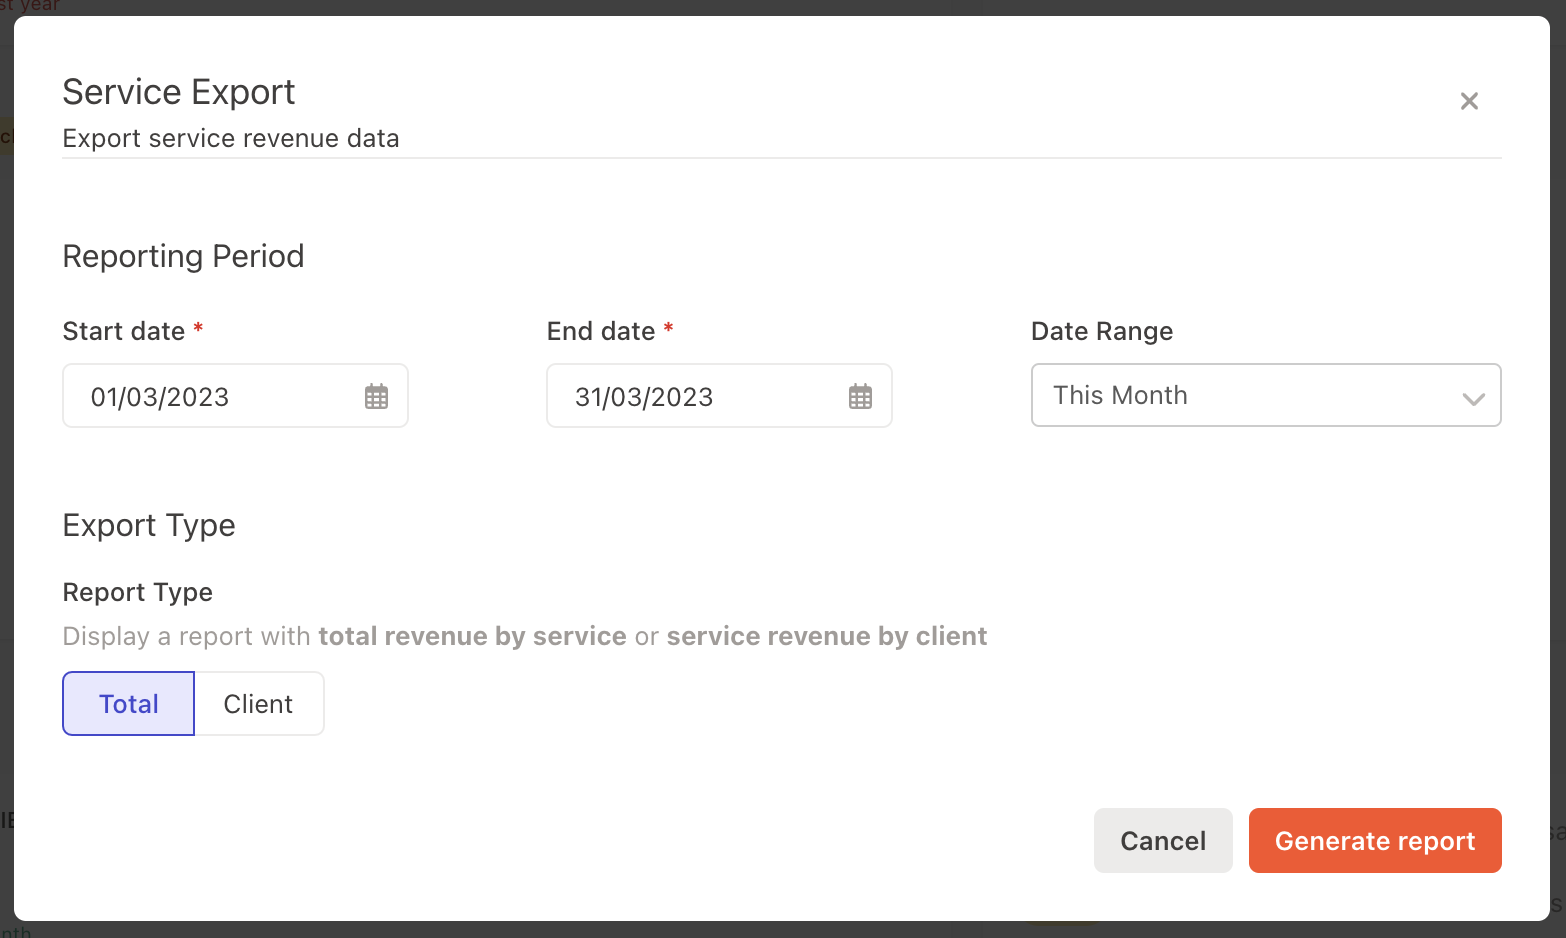
Then, select the Export Type - either total revenue by service or service revenue by client.
If you want an aggregate overview of the total amount of services sold, select Total.
If you want a breakdown of all services sold per client, select Client.
Pro-tip: If you’re not sure, select Client for now as we can aggregate the data in the CSV file further if you wish. It provides more granularity.
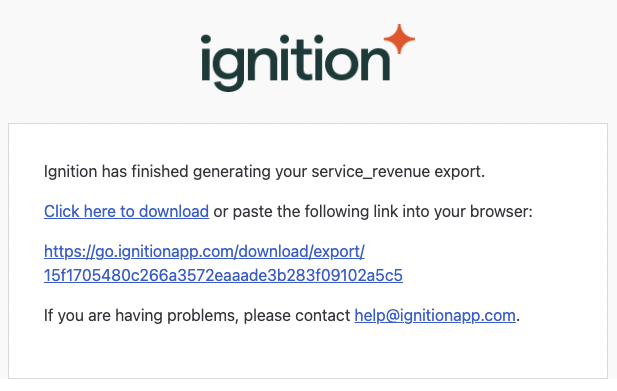
Once you export, you’ll receive an email with a link to download the CSV.
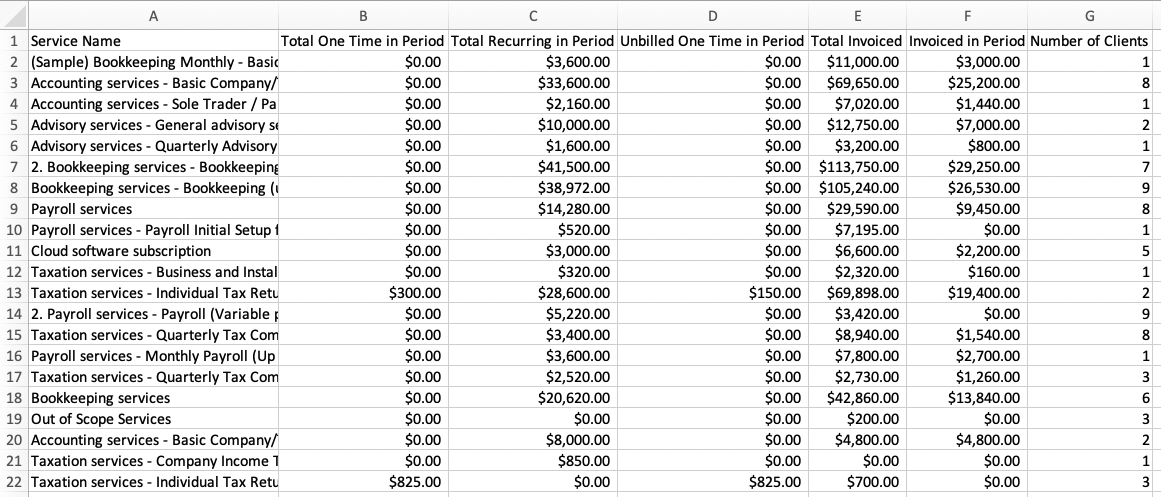
Total revenue by service
The total revenue by service export displays an aggregate total amount of services sold as well as the total number of clients that are receiving those services.
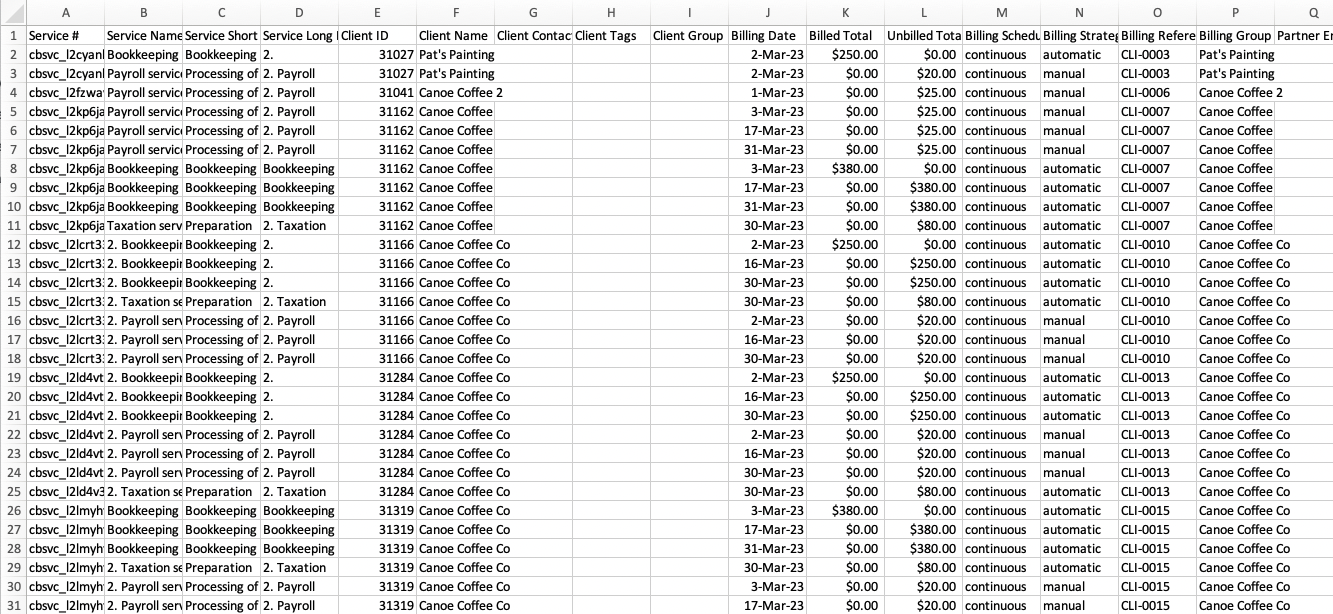
Service revenue by client
The service revenue by client export displays every single service that each client is paying for.
It displays one service per row for every client.
Data filtering and use cases
You can apply pivot tables, filtered views and sorting to identify the data that you need to make the most informed decisions for your business.
As a general rule, we suggest using and looking at these columns:
Service name
Client name
Billed total
Let’s take a look at different use cases of your own personalized data.
Identifying strengths and weaknesses
In this example below, we have used Google Sheets to apply a pivot table using Service Name in the Rows and Billed Total in the Values.
This tells us about the popular services, as well as potential areas of improvement.
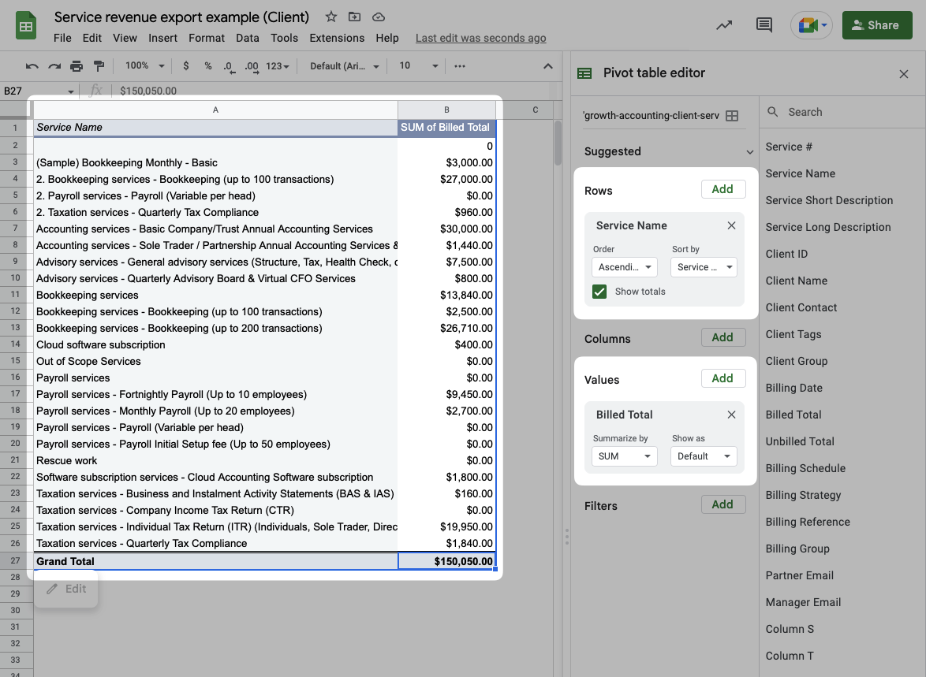
This could be used to identify your strengths and weaknesses in your business, but it is up to you to interpret.
You could choose to lean into your strengths more if you realize that the less popular services in your business take too long or aren’t worth your time.
On the contrary, you could identify services that don’t take much of your time but are high value and start to upsell or cross sell them in your initial chats with your clients.
Identifying your client base
In this example below, we have used Google Sheets to apply a pivot table using Client Name in the Rows and Billed Total in the Values.
This tells us about your client base. It identifies if there are any high value clients as well as any opportunities for upselling.
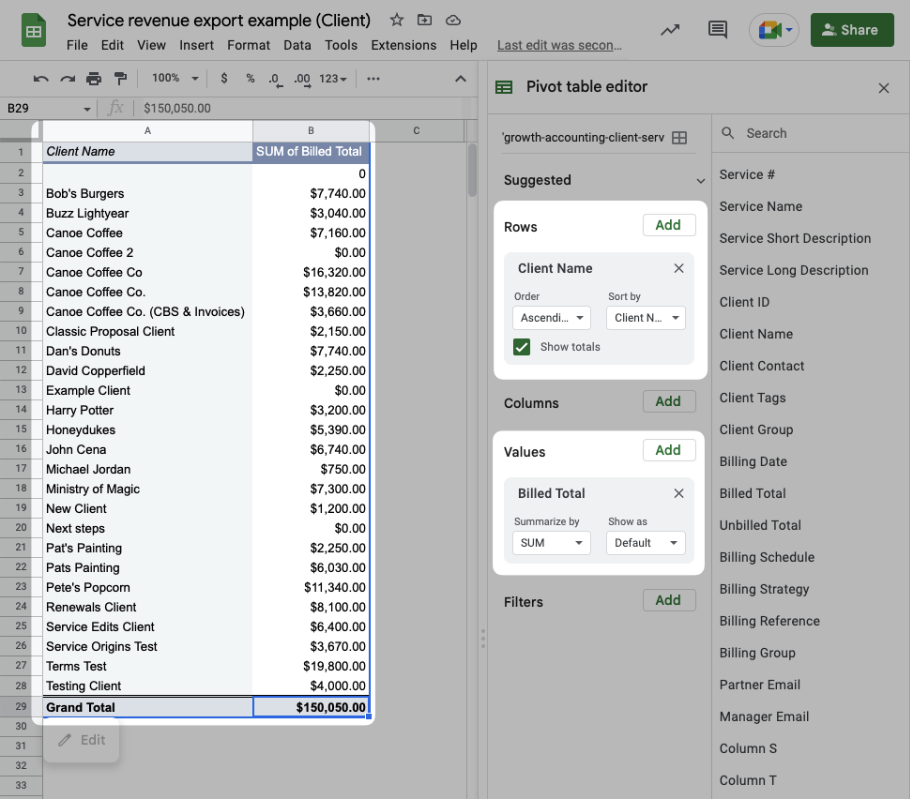
You might be surprised when comparing your client’s Billed Total in this way and discover high net worth clients that might be deserving of more of your time. Similarly, you might discover some clients are lower net worth in comparison and you might want to manage your time accordingly.
You can also identify client types as well, realizing that a certain type of client is worth more (e.g. business clients are generally worth more than individual clients)
Alternatively, if you realize that you work better with individuals vs businesses then you may want to lean into selling to individuals and honing your service offering.
Capturing forgotten payments
To identify which clients that have outstanding payments that you might have forgotten to bill, you can use Client Name and Billing Strategy in the Rows and Unbilled Total in the Values.
Then, apply a filter to the Billing Strategy and show only Manual.
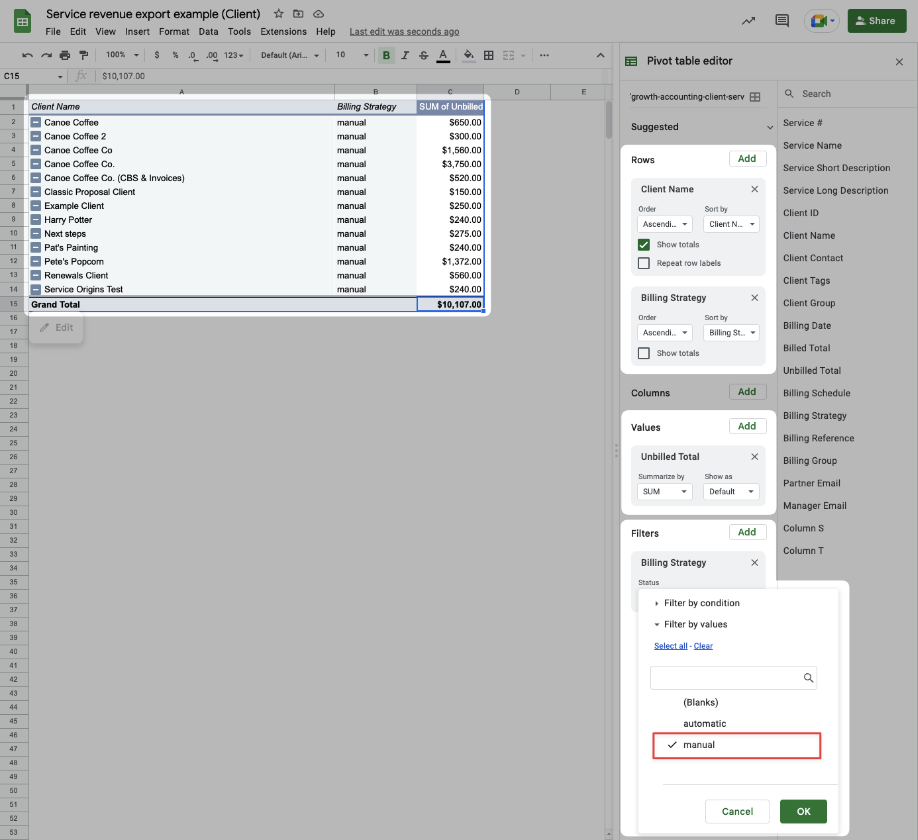
This shows you all of your clients which have outstanding bills.
You can navigate to these client’s Billing Schedule tabs in Ignition and invoice all of their manual billing items, as long as the service has been provided.
Note: This method only works if your reporting period in this sheet is in the past (e.g. the previous financial or calendar year). If it is a current reporting period then it may not be accurate due to current ongoing engagements that still have manual billing items.
Out of scope services
If you have any out of scope services that you have billed for, use a pivot table and apply Service Name and Client ID in the Rows and Billed Total in the Values.
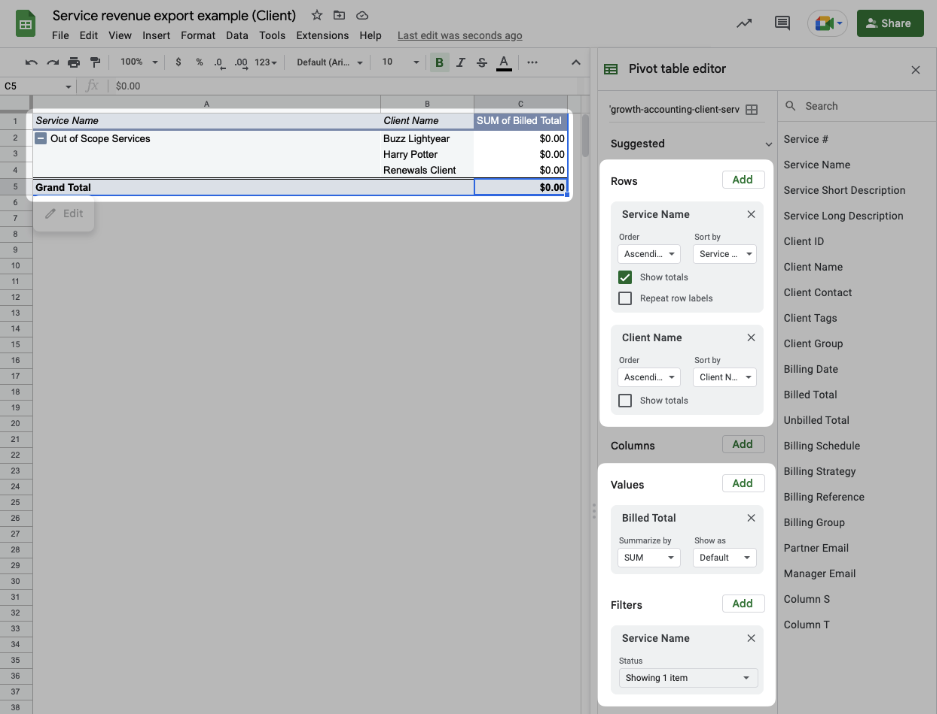
This allows you to see if any clients have any out of scope services that you might have billed for.
You may want to consider increasing the service level for these clients or even add additional services to their next agreements to account for scope creep.

